2. Gray correlation evaluation of casting sand performance
Taking a Z148E modeling production line of a factory as the research object, the sand was tracked and sampled, and the water content, wet compressive strength, compaction rate and air permeability were used as the performance evaluation indexes of the sand, and the five sand samples were evaluated. The specific data is shown in Table 1.

Machine molding requirements for sand performance: water content of 3 % ~ 5 %, wet compressive strength of 0.07 ~ 0. 10MPa, compaction rate of 44% ~ 52%, air permeability of 80% ~ 100%. The best performance index of the molding sand: moisture content of 4.0%, wet compressive strength of 0. 085 MPa, compaction rate of 48%, and air permeability of 95%. By comparing the gray correlation analysis of the performance and the best performance of the five sand samples, the performance of each sand can be evaluated.
The gray correlation degree analysis evaluates the performance of sand type by using the optimal sand sample index as the evaluation series, and the sand sample index to be evaluated as the comparison series, calculating the correlation degree between each comparison sample and the evaluation sample, and determining each to be evaluated according to the degree of relevance. pros and cons of sand samples. The comparison sequence is: xi( k) = { xi1 , xi2 , xi3 , xi4}xik represents the kth evaluation index value of the ith comparative sand. i =1 , 2 , ⋯, 5 respectively represent 5 kinds of sand to be evaluated; k = 1 , 2 , 3 , 4 respectively indicate moisture content, wet compressive strength, compaction rate and air permeability of sand performance evaluation indexes.
The evaluation number is: x0( k) = { x01 , x02 , x03 , x04}x0 k represents the kth evaluation performance index value of the optimum molding sand. k =1 , 2 , 3 , 4 . The raw data obtained from the evaluation sample and the comparative sample are shown in Table 2.

The results of dimensionless processing of the original data according to equations (3) to (5) are shown in Table 3. The results of calculating the difference between each comparison series and the evaluation series are shown in Table 4. The minimum difference between the two poles is 
The maximum difference between the two poles is  Calculate the correlation coefficient of the comparison sample according to formula (1). The results are shown in Table 5.
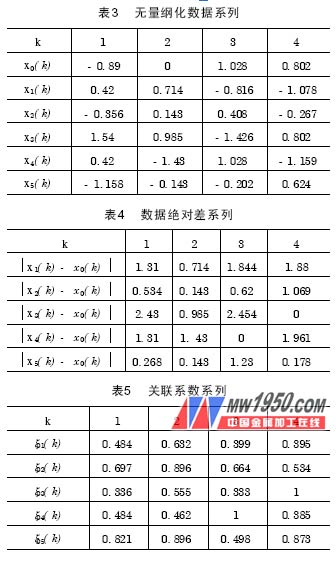
Calculate the correlation degree of the comparison sample according to the formula (1) as: r 01 = 0. 4775 , r 02 = 0. 6978 , r 03 = 0. 556 , r 04 =0. 5828 , r 05 = 0. 772 . Since r 05 > r 02 > r 04 > r 03 > r 01 , the order of the performance of the five types of sand is: 5, 2, 4, 3, 1.
3. Conclusion
The evaluation of sand performance involves many factors of ambiguity and randomness. The gray correlation degree evaluation method can deal with partial determination and uncertainty information in the system, which provides a new way for sand performance evaluation. It can quantitatively deal with the grey factors in the evaluation, and all the evaluation indicators have an impact on the effective data price comparison results. The evaluation process has no loss of information, and the evaluation results are intuitive and reliable, which makes up for the shortcomings of the traditional evaluation method.
In this paper, the gray correlation analysis method is used to evaluate the comprehensive performance of various casting sands, and the original data is dimensionlessly processed by the central method, which improves the identification effect of the evaluation and makes the evaluation results of the sand performance more scientific and reasonable.
Previous page
Floorstanding Bathtub Faucet,Floor Stand Faucet,Bathtub Faucet Tap,Bathtub Faucet Brass
kaiping aida sanitary ware technology co.,ltd , https://www.aidafaucets.com